
Revenue Report
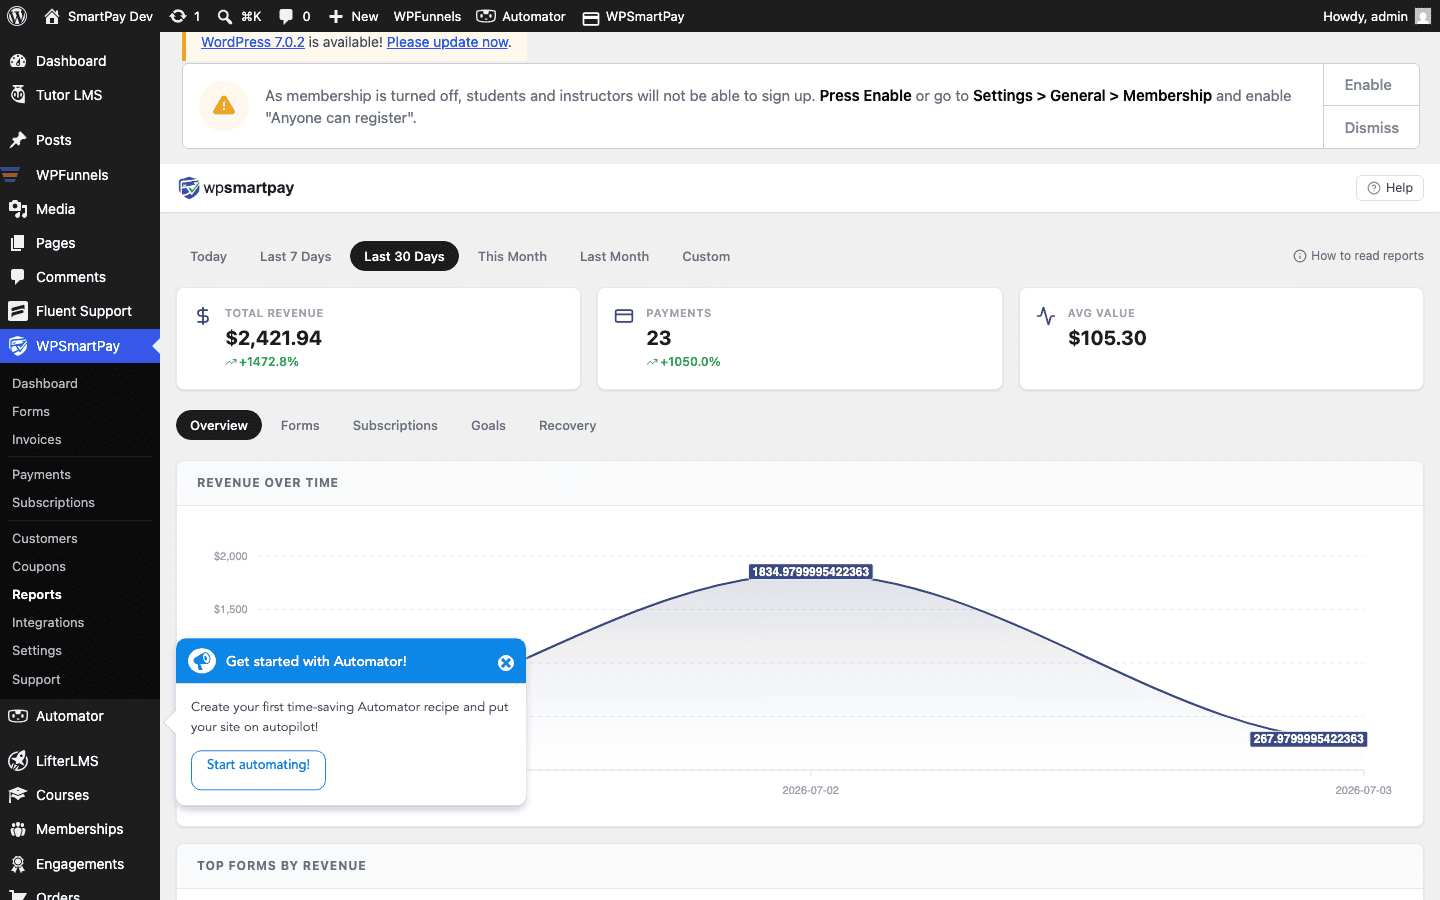
The Revenue report is the main financial overview in WP SmartPay Pro. It shows your total earnings, order volumes, and average transaction value for any time period, along with a month-by-month bar chart and a breakdown of top performers.
Opening the Revenue Report
Go to SmartPay → Reports. The Revenue tab is selected by default.
Stats Cards
Four headline metric cards appear at the top of the report:
- Total Revenue — Sum of all completed payment amounts in the selected period. Refunded and failed payments are excluded.
- Total Orders — Count of completed payments in the period.
- Average Order Value — Total Revenue ÷ Total Orders.
- New Customers — Number of first-time paying customers (customers whose first completed payment falls within the period).
Revenue Bar Chart
The bar chart displays completed payment revenue grouped by:
- Day — When the date range is Today or 7 days or fewer.
- Week — When the date range spans several weeks.
- Month — When the date range is a month or longer.
Hover over any bar to see the exact revenue for that period. The chart uses your store currency.
Top Forms
Below the chart, a table lists the top-performing payment forms ranked by revenue in the selected period. Each row shows the form name, total payments, and revenue. Click a form name to jump to its editor.
Top Products
If you use digital products in addition to payment forms, a second table lists top-earning products by the same metrics.
Comparing Periods
To compare revenue month-over-month, use the custom date range selector:
- Set the range to last month (e.g., June 1–30).
- Note the revenue figure.
- Change the range to the current month (e.g., July 1–31).
- Compare.
SmartPay does not show a side-by-side comparison view — you need to compare periods manually by switching the date filter.