
The Revenue report is the main financial overview in WP SmartPay Pro. It shows your total earnings, order volumes, and average transaction value for any time period, along with a month-by-month bar chart and a breakdown of top performers.
Opening the Revenue Report
Go to SmartPay → Reports. The Revenue tab is selected by default.
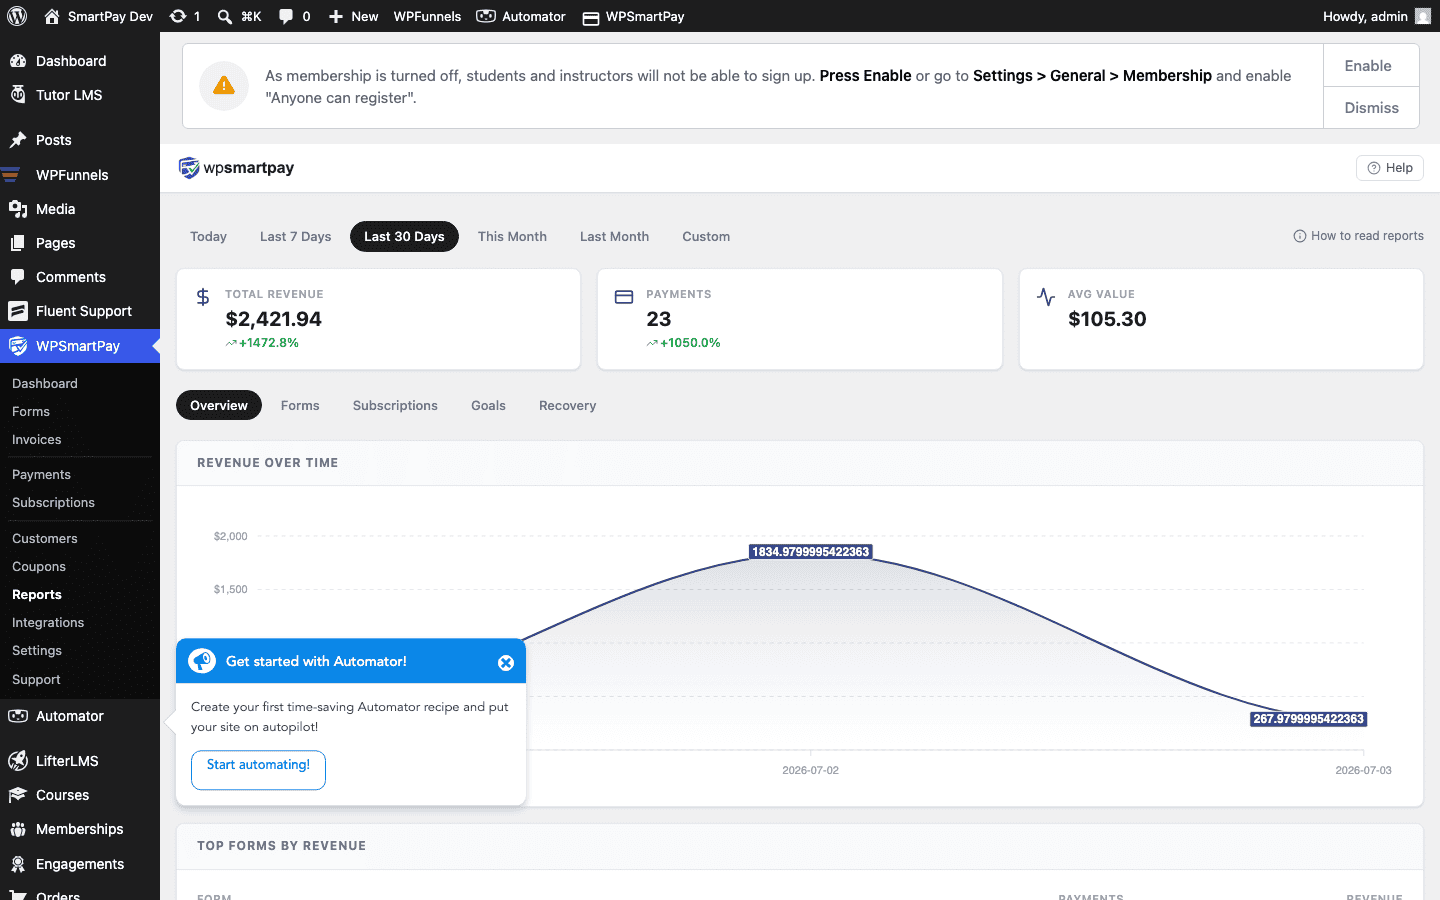
Stats Cards
Four headline metric cards appear at the top of the report:
- Total Revenue — Sum of all completed payment amounts in the selected period. Refunded and failed payments are excluded.
- Total Orders — Count of completed payments in the period.
- Average Order Value — Total Revenue ÷ Total Orders.
- New Customers — Number of first-time paying customers (customers whose first completed payment falls within the period).
Revenue Bar Chart
The bar chart displays completed payment revenue grouped by:
- Day — When the date range is Today or 7 days or fewer.
- Week — When the date range spans several weeks.
- Month — When the date range is a month or longer.
Hover over any bar to see the exact revenue for that period. The chart uses your store currency.
Top Forms
Below the chart, a table lists the top-performing payment forms ranked by revenue in the selected period. Each row shows the form name, total payments, and revenue. Click a form name to jump to its editor.
Top Products
If you use digital products in addition to payment forms, a second table lists top-earning products by the same metrics.
Comparing Periods
To compare revenue month-over-month, use the custom date range selector:
- Set the range to last month (e.g., June 1–30).
- Note the revenue figure.
- Change the range to the current month (e.g., July 1–31).
- Compare.
SmartPay does not show a side-by-side comparison view — you need to compare periods manually by switching the date filter.