
The WP SmartPay Pro Forms report gives you a per-form performance breakdown showing how many visitors see each form, how many convert into paying customers, and how much revenue each form generates.
Opening the Forms Report
- Go to SmartPay → Reports.
- Click the Forms tab.
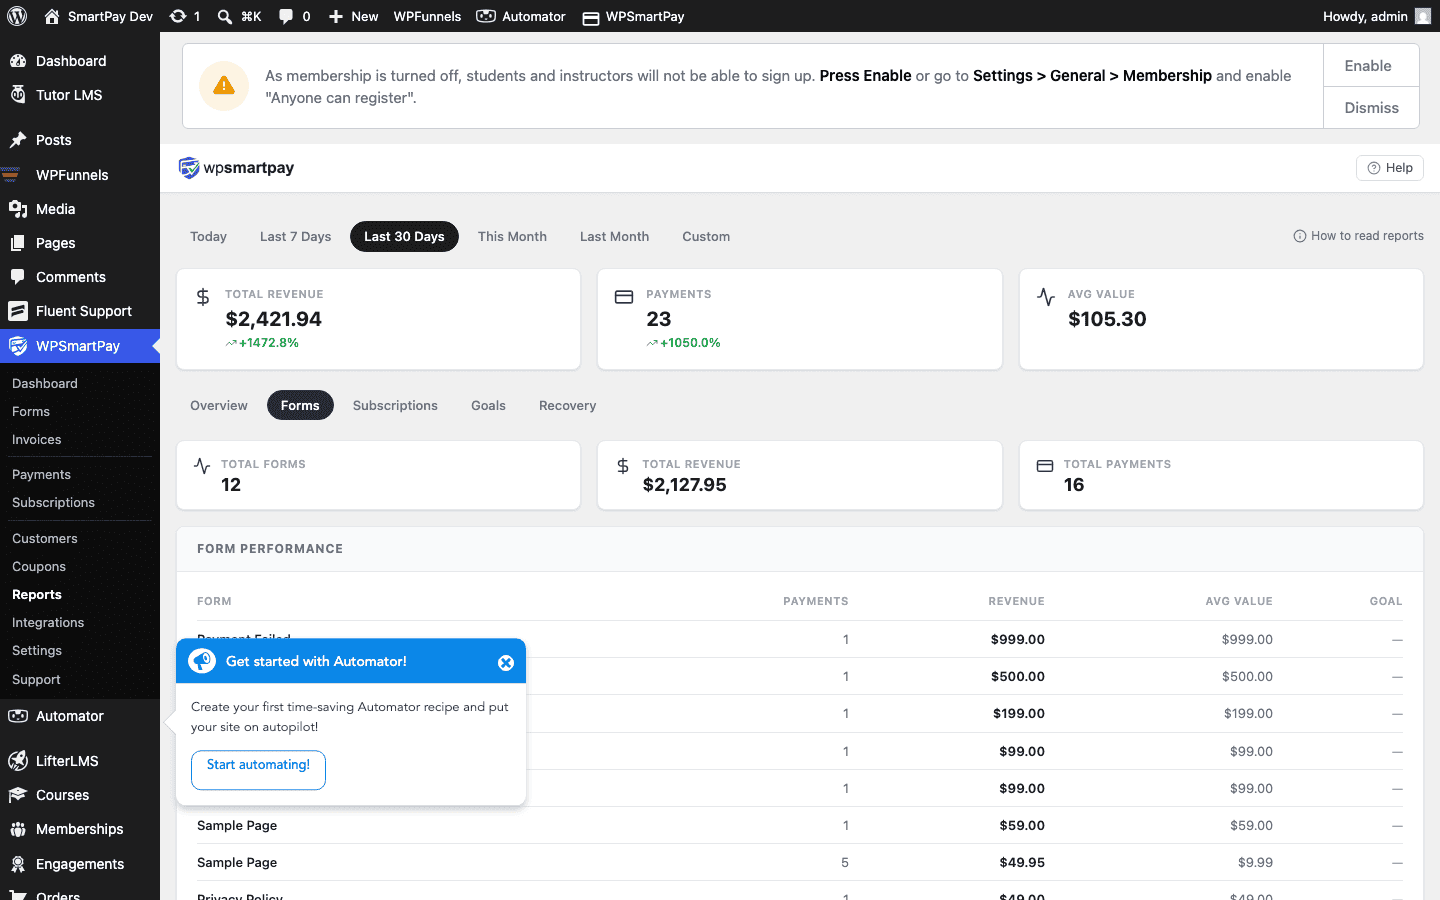
Column Reference
- Form Name — The title of the payment form as set in the editor.
- Views — Total number of times the form was loaded on a published page. Counts each page load, not unique visitors.
- Completions — Number of completed (successful) payments submitted through this form in the selected period.
- Revenue — Total amount of completed payments through this form.
- Conversion Rate — Completions ÷ Views × 100, expressed as a percentage.
Sorting the Table
Click any column header to sort ascending; click again for descending. Useful sorts:
- Revenue ↓ — Find your highest-earning form.
- Views ↓ — Identify your most-seen forms regardless of conversion.
- Conversion Rate ↑ — Find forms that convert poorly and may need improvement.
Understanding Conversion Rate
The conversion rate tells you what percentage of visitors who see the form actually pay.
- Low rate + high views — The form is discovered often but something is stopping completion. Possible causes: price too high, confusing layout, gateway issues, or required login without a clear prompt.
- High rate + low views — The form converts well but gets limited traffic. Consider linking to it more prominently or embedding it on high-traffic pages.
- Both low — The form may be on a seldom-visited page, or it may have a friction issue at checkout.
Note: Views are only tracked when the shortcode [sp_form id="…"] or the WP SmartPay Form block is rendered on a published, publicly-accessible page. Views from password-protected pages, editor previews, and admin-only pages are not counted.